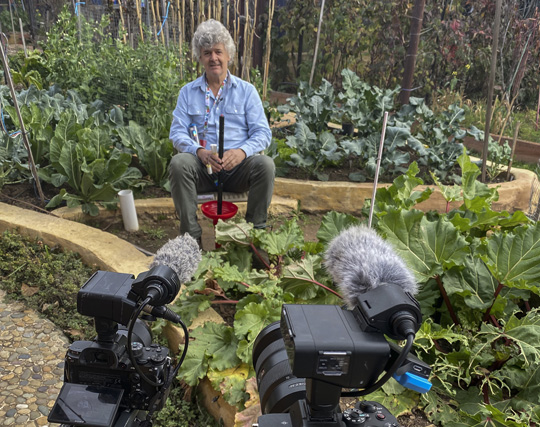
Come on a learning journey with us as we explore the big questions of irrigation and dive deeper into the science of turning water into food.
Learning by doing is at the heart of the VIA. In our first course of the Water School, Richard takes you through a year in his garden laboratory.
The course is called "A Journey via the Scientist's Garden" and can be can be done in two ways. For those who want an introduction to the VIA in action, you can watch the Garden Documentary below. For those who want to go deeper into the science, we encourage you to enrol in the Water School.
Introduction to the journey
The video introduces the story behind the VIA. We give you a basic overview of the monitoring equipment and the data visualisation platform and what the Water School is all about. Why don’t farmers do what we tell them? (presentation) The presentation unpacks the video by looking at the historical development of soil water sensors, their adoption by irrigators and the different ways that scientists and farmers create and validate knowledge. |
|
Learning by colour
The video was filmed during the spring. We explain the colour output of the sensors. We track water monitoring for a broad bean crop, nitrate monitoring in an onion crop and salt monitoring in tomatoes. What do those colours mean? (presentation) The presentation unpacks the video by showing what the colours from the monitoring sensors mean. We explain how we derive the colour thresholds for action for water and nitrate. |
|
Colours and patterns
The video was filmed during the summer when the garden is in full swing. We investigate furrow irrigated tomatoes, trying to work out where the water is going and where the roots are active. Triple loop learning (presentation) The presentation unpacks the video with examples of water, salt, nitrate patterns and how we interpret them. It ends with some theory around learning for sustainable irrigation management. |
|
When to water
The video was shot in late summer when the weather is hot and irrigation is more critical. We show how crop growth stage and drip, furrow or flood irrigation give us different Chameleon colour patterns. Getting our roots down deeper (presentation) The presentation unpacks the video with further examples of interpreting Chameleon patterns and how the thresholds for action are set. We conclude with some case studies of over- and under-irrigation. |
|
Feast and famine
The video marks the change of seasons from summer to autumn when the cool-season crops are planted. We see problems of overproduction and the ‘hungry gap’ and explore some of the deep dilemmas of irrigation. VIA data analytics (presentation) The presentation moves us beyond irrigation scheduling to irrigation management at larger scales. We show how data can be aggregated to summarise the performance of whole irrigation schemes over time. |
|
It gets complicated
The video was filmed in late autumn when irrigation is hardly needed on cool-season crops growing into the winter. We give you a crash course in soil science with a range of demonstrations to show how soils hold water. What is in the water? (presentation) The presentation provides more detail around managing salt in irrigation agriculture, and how to leach salt without leaching nutrients. |
|
The life of a sensor
The final video tracks the life of a sensor, from its testing in the lab to troubleshooting in the field and then we tie up all the loose ends from journey. Bringing it all together (presentation) The presentation revises concepts around how soils hold water and how the Chameleon sensors work. We also revise the different ways that scientists and farmers create knowledge, and how we move from monitoring and learning to social change. |